Canary Releases With Argo Rollouts and Prometheus Metrics
Automated traffic shifting and metrics-driven gates eliminate the manual toil from canary releases.
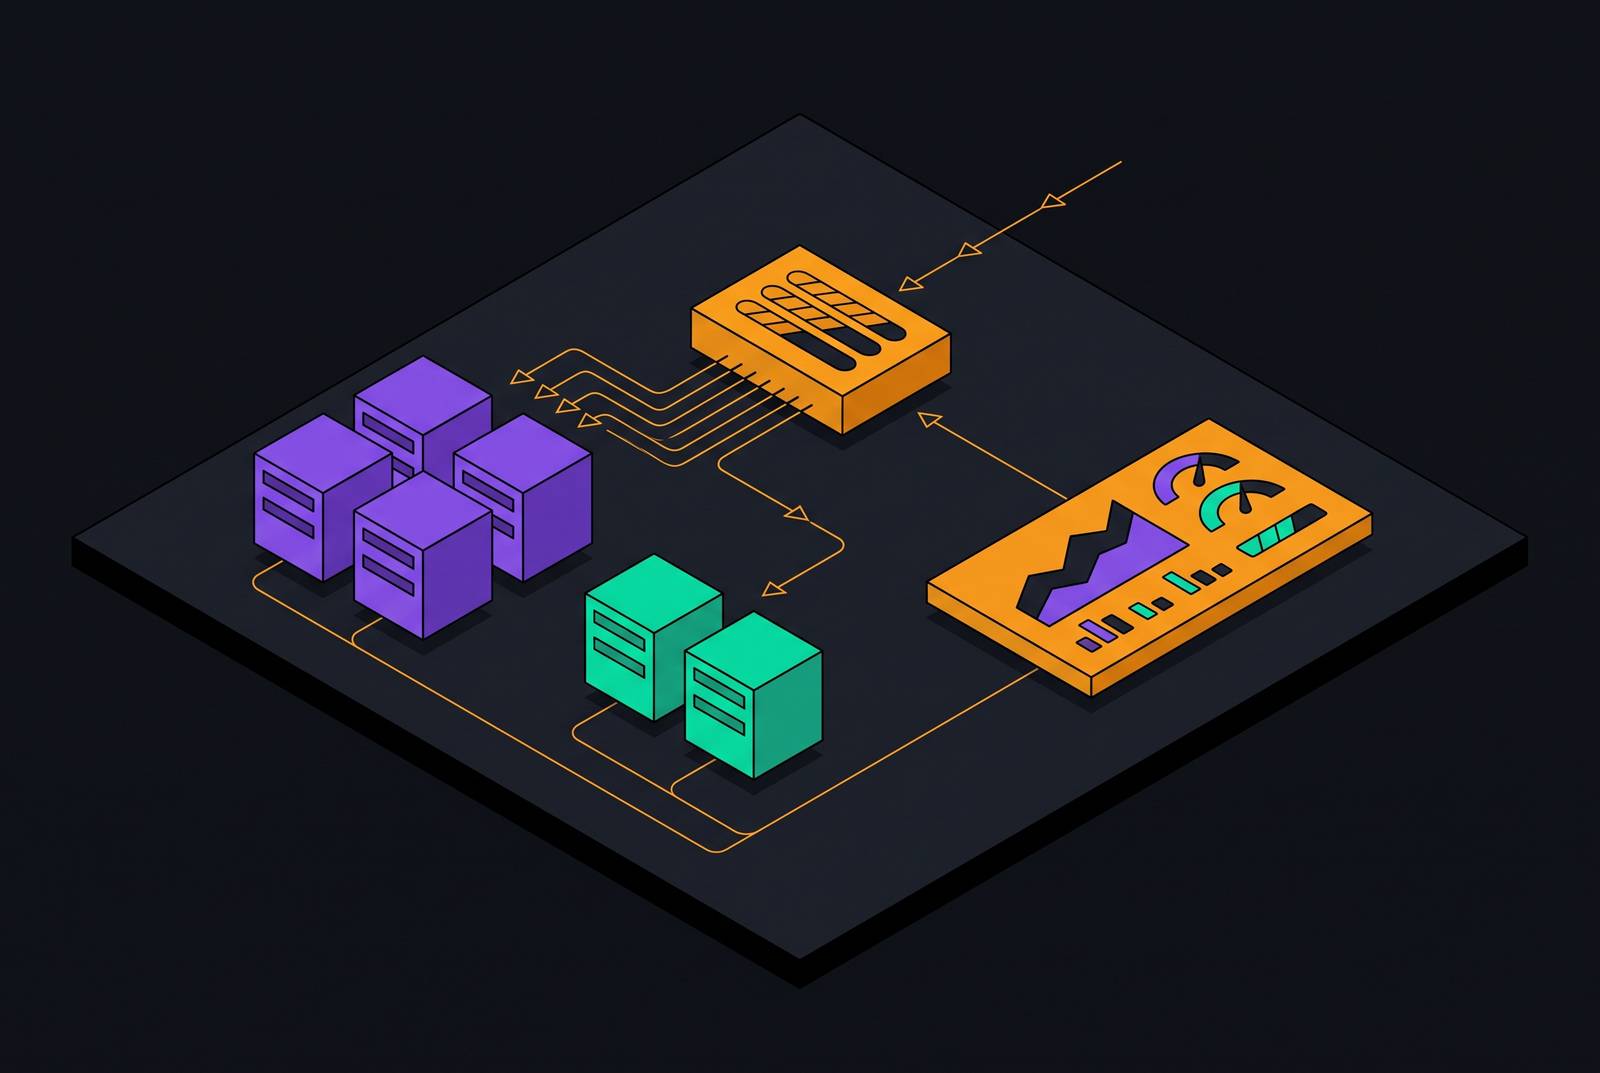
Canary releases only reduce risk when promotion and rollback decisions are driven by real evidence, and the Argo Rollouts + Prometheus pairing gives teams a concrete, automatable path from traffic shifting to data-driven gate to automatic rollback, turning a manual observation problem into a structured delivery workflow.
Limitations of standard Kubernetes rolling updates for safe production releases
A Kubernetes Deployment rolling update replaces old pods with new ones gradually, but the moment a new pod passes its readiness probe, it starts taking full production traffic, no exceptions, no throttle. That readiness check confirms exactly one thing: the pod can accept connections. It says nothing about whether the code behind those connections is correct. A pod that passes its readiness check and then serves a high rate of 500 errors is, as far as the Deployment controller is concerned, healthy (the rollout proceeds while the error rate climbs).
Kubernetes was never built to ask that question. It was built to keep a target number of pods running and to swap them out without downtime, which is a scheduling problem, not a release-quality problem.
When something does go wrong, recovery depends on a human noticing. kubectl rollout undo exists and works fine, but it only fires after an alert has gone off, someone has correlated that alert with a specific release, and that person has decided to act. Every one of those steps takes time, and production keeps degrading throughout. The gap here isn't about pod health at all: it's about release health, whether this specific version is improving, holding steady, or quietly breaking the metrics that actually define "working." Closing that gap is the whole reason canary releases and progressive delivery exist as a discipline.
Canary releases versus blue-green deployments
A canary release sends a small slice of real production traffic to a new version, watches how it behaves under genuine load, and only expands that exposure once the data backs it up. Instead of a single all-or-nothing rollout, progressive delivery breaks the release into a sequence of small, reversible steps, each one gated on a metric before it's allowed to proceed. If a gate fails, the system reverts on its own, typically within seconds under the default traffic-routing abort path, and nobody has to be paged to make that call. The release either earns its next step or it doesn't, and the decision is made by evidence rather than by whoever happens to be watching a dashboard at the time.
Canary suits stateless services well, and it fits backward-compatible changes where a brief window of partial exposure to production traffic is a risk worth taking. Blue-green solves a different problem. Instead of exposing a slice of users to the new version, blue-green stands up the new version (green) fully alongside the old one (blue) and cuts traffic over in a single move, with a fast path back if that move goes wrong. The tradeoff is resource cost: running two full production environments side by side roughly doubles the footprint during the cutover window. Blue-green is the right call when even minimal exposure of real users to an unproven version is not acceptable, full stop, no partial testing on live traffic.
Both strategies exist to reduce the same category of risk, and the decision between them comes down to how much live exposure a team is willing to tolerate before flipping the switch. The remainder of this piece follows the canary path specifically: how traffic shifts happen, how metrics gate each step, and how rollback gets triggered automatically rather than by a human watching a graph.
Argo Rollouts and the gap it fills beyond Istio and plain scripting
Argo Rollouts is a Kubernetes controller paired with a set of custom resource definitions that add blue-green, canary, canary analysis, experimentation, and progressive delivery as native capabilities rather than bolted-on scripts. It works by replacing the standard Deployment object with a Rollout resource, and the substitution is deliberately low-friction: the familiar spec.template pod definition stays exactly where it was, and what gets added is a spec.strategy block that describes how the release should progress. Teams that already understand Deployments aren't starting from zero.
Adjacent tools cover different ground, and the combination of automated traffic shifting and metric-driven promotion is the actual differentiator. A plain Deployment with carefully tuned maxSurge and maxUnavailable values is simpler to operate and has no extra controller running, and for teams that don't need metric-driven promotion, that simplicity is the right choice. Istio by itself gives real traffic-splitting primitives, routing rules, weighted destinations, the mechanics of moving load between versions, but it has no concept of a rollout state machine, no AnalysisTemplate construct, and no built-in logic to read metrics and decide whether to promote or abort. Istio can move the traffic. It cannot decide whether moving more of it is a good idea. Imperative CI/CD scripts run into a related problem: they can approximate a canary process, but the state of that process lives in script logic and pipeline history rather than in a queryable Kubernetes object, so rollback across environments ends up inconsistent and hard to audit after the fact.
A critical security issue affecting the Argo Rollouts dashboard was disclosed in late August 2026; the specifics of that advisory should be confirmed directly against the official GitHub security advisory rather than repeated secondhand Progressive Canary Releases with Argo Rollouts Analysis and Linkerd Metrics - Mad Mirrajabi. The project shows active development, with v1.10.0 released 2026-08-27, v1.9.1 on 2026-07-17, the last repository push on 2026-09-23, and v1.9.0 GA announced at ArgoCon North America Progressive Canary Releases with Argo Rollouts Analysis and Linkerd Metrics - Mad Mirrajabi. ArgoCon is scheduled in Salt Lake City, colocated with KubeCon North America 2026, on November 9 (relevant for readers tracking the community roadmap) Progressive Canary Releases with Argo Rollouts Analysis and Linkerd Metrics - Mad Mirrajabi.
How an Argo Rollouts canary steps sequence works
The engine driving a canary release in Argo Rollouts is the spec.strategy.canary.steps list on the Rollout object. Each entry in that list runs in order, and the rollout controller pauses at each one until the step either completes or fails outright. Three step types make up nearly every canary flow in practice.
That indefinite pause in the middle of an otherwise automated sequence is a deliberate split of responsibility. It's a deliberate split of responsibility: automated metric gates are built to catch technical regressions, error rates spiking, latency creeping up, while the manual gate reserves the actual business call, whether this release should go fully live, for a human. In regulated environments especially, that split is defensible in a way a fully automated pipeline isn't.
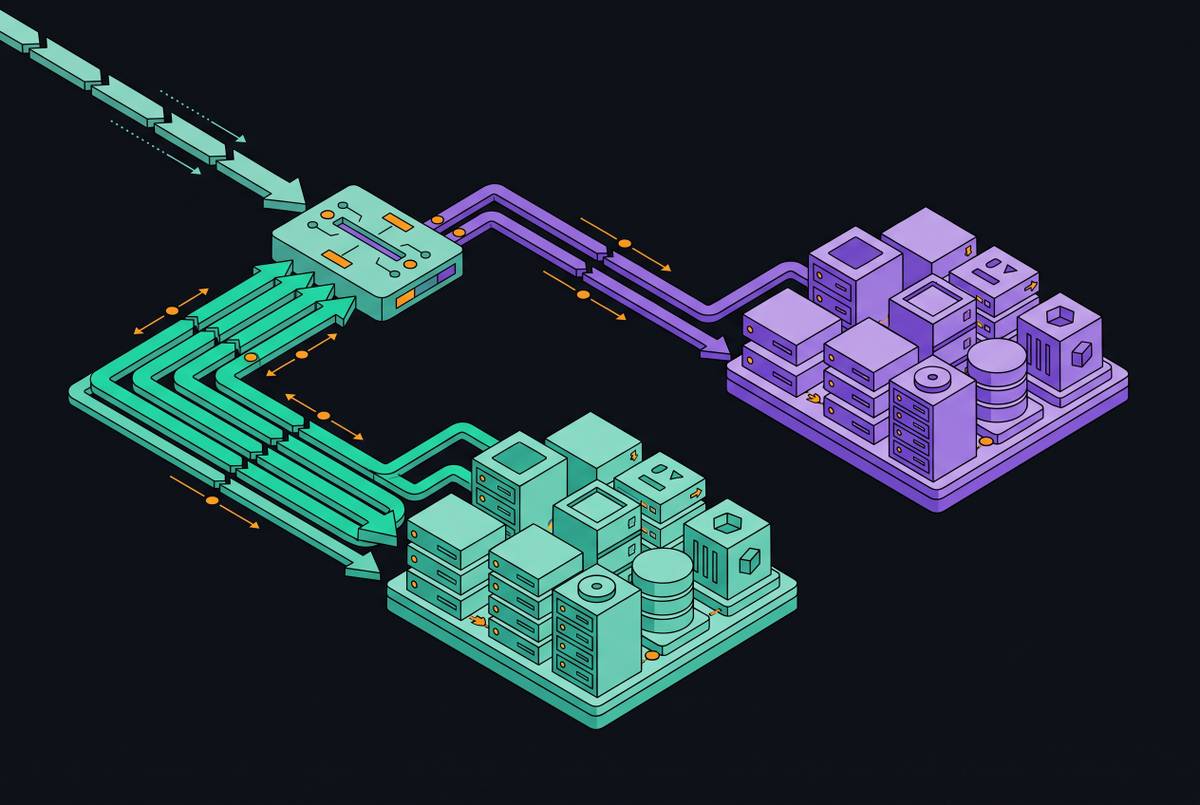
Underneath the steps, there are two genuinely different ways Argo Rollouts controls traffic, and the distinction affects how traffic shifting behaves under low replica counts. Replica-ratio canary approximates the target weight by adjusting how many canary pods versus stable pods are running, which becomes a blunt instrument once replica counts are low. Weighted traffic splitting, by contrast, requires a trafficRouting block wired into an actual network-layer provider such as NGINX, Istio, AWS ALB, or a Gateway API plugin, and it delivers a precise percentage regardless of how many replicas are running.
That separation makes per-version metric labeling and traffic isolation possible. The controller also automatically injects a rollouts_pod_template_hash label onto pods, and that label lets a Prometheus query isolate canary-pod metrics from stable-pod metrics when both versions are running side by side. setWeight shifts a percentage of traffic to the canary ReplicaSet, for example 5%, then 25%, then 50%, then 100%. pause holds at the current weight for a fixed duration, such as duration: 2m or duration: 5m, to let metrics accumulate, or indefinitely (pause: {}) for a manual promotion gate. analysis runs an AnalysisTemplate and blocks promotion until the analysis completes, aborting on failure and continuing on success. The canaryService and stableService fields point to two separate Services fronting the canary and stable ReplicaSets respectively, which is necessary for per-version metric labeling and traffic isolation.
The AnalysisTemplate CRD: how metric gates are defined and composed
The choice between them is organizational as much as technical. Cluster-scoped templates cut down on duplication and suit a platform team that wants to enforce a shared metric policy across every service in the cluster, while namespace-scoped templates hand that control back to individual teams, appropriate when a service's metrics genuinely are its own business.
provider names the backend supplying the data, which can be Prometheus, Datadog, Wavefront, Kayenta, a generic Web provider, Kubernetes Jobs, New Relic, Graphite, or InfluxDB.
Templates accept arguments, which is what keeps them reusable rather than copy-pasted per service. The same AnalysisTemplate can take a service name, a canary hash, a stable hash, even a Prometheus port, as parameters, so one template definition can serve every Rollout in a fleet instead of being duplicated service by service. Wiring that template into an actual Rollout happens through the analysis step, which references the template by templateName and passes in those arguments; there's also a background analysis option that runs continuously across the whole rollout rather than only firing at discrete gate points.
Metrics can also be defined inline, directly inside a Rollout step, without a separate template at all. That's a reasonable shortcut for a one-off validation that only ever applies to a single Rollout, but the moment a metric gets reused across more than one Rollout, the AnalysisTemplate reference is the right call, since it keeps the definition in one place instead of scattered across manifests. Whatever the analysis decides, promote or abort, gets written into an AnalysisRun CRD, which functions as an in-cluster, queryable record of exactly which metric values justified that decision. The controller doesn't keep that history forever: it retains only the most recent runs per Rollout, defaulting to five successful and five unsuccessful runs each, accessible through kubectl get analysisruns or kubectl describe. interval specifies how often the query runs, for example every 1m, 2m, or 15s. count specifies the total number of measurements to take, for example 5. successCondition is a Boolean expression evaluated against the returned result, and if true, the measurement passes. failureLimit specifies how many failed measurements cause the entire analysis to be marked failed, for example 1 or 2 Canary Releases with Argo Rollouts — Tran Ngoc Minh Duc.
Configuring the Prometheus provider: PromQL, success conditions, and the vector result subtlety
This trips people up in production. A condition has to account for the possibility of zero results, one result, or multiple results, every single time, because Prometheus makes no promise about which of those it hands back. A condition written as result >= 0.95, with no check on how many elements are actually in that vector, panics outright if the vector comes back empty [0]. That's not a hypothetical edge case. These gates most commonly break in real clusters the first time a label mismatch or a scrape gap returns nothing.
The fix is to check the shape of the result before checking its value. A success condition written as len(result) == 1 && result >= 0.99 only passes when exactly one series comes back and that series clears the threshold Canary Releases with Argo Rollouts — Tran Ngoc Minh Duc [0]. The corresponding failure condition should catch the other side of that same coin, firing when more than one series comes back, or when exactly one comes back and it falls below whatever the acceptable floor is. failureLimit set to two, in that pattern, gives the gate a small amount of tolerance for a single noisy measurement without letting a real regression slide through [0].
PromQL decides which time series exist and what values they carry. The conditions decide how Argo Rollouts interprets whatever comes back. Getting the PromQL right but leaving the conditions naive is how a gate ends up either panicking on an empty vector or, worse, passing silently when it shouldn't. Run the PromQL expression in the Prometheus GUI first, before it ever goes into an AnalysisTemplate, because that's where cardinality surprises and label mismatches show up before they cause a silent failure in a live release. And both conditions should be set together, not just one or the other: failureCondition catches the obvious, sharp failures and triggers rollback immediately, while successCondition is what catches the slower, gradual kind of degradation that doesn't cleanly satisfy either condition on any single measurement. The Prometheus provider block within an AnalysisTemplate requires certain fields to be configured. address specifies the Prometheus server URL, for example http://prometheus.monitoring:9090. timeout is optional and specified in seconds, for example 20. headers are optional and used for multi-tenant setups, for example X-Scope-OrgID. There is a robust pattern for handling this, as described by oneuptime.com in August 2026. Both layers must be designed and tested independently: PromQL determines which time series and values Prometheus returns, while the success and failure conditions determine how Argo Rollouts classifies that returned value.
Prometheus metrics to gate on, with example PromQL for each
No single metric tells the whole story of a release. Error rate can look fine while latency creeps up. Latency can hold steady while throughput quietly collapses. The working pattern is to check error rate, latency, throughput, and whatever business metric actually matters for the service, together, rather than betting a promotion decision on any one of them in isolation.
Error rate is the most common starting gate, and it's a reasonable template to walk through in full. The PromQL behind it isolates the canary's error rate specifically by filtering on the rollouts_pod_template_hash label injected by the controller, summing the rate of 5xx responses over a five-minute window and dividing by the total request rate over that same window for that same canary hash.
That single query illustrates the mechanism, but the same construction, filter by rollouts_pod_template_hash, aggregate over a rolling window, compare canary against stable, extends naturally to latency percentiles, request throughput, and whatever business-specific signal a given service actually needs to protect. The interval is 2m, with a count of 5. failureCondition is set as result >= 0.10, an error rate at or above 10%. failureLimit is set to 3 [0].
Sources
- Argo Rollouts | Argo
- Progressive Canary Releases with Argo Rollouts Analysis and Linkerd Metrics - Mad Mirrajabi
- Canary Releases with Argo Rollouts — Tran Ngoc Minh Duc
- Canary - Argo Rollouts - Kubernetes Progressive Delivery Controller
- Analysis & Progressive Delivery - Argo Rollouts - Read the Docs
- Prometheus Metrics - Argo Rollouts - Read the Docs
- Argo Rollouts Prometheus Analysis: Arrays, NaN, and Empty Results